


Ominous Clouds behind Pasadena City Hall (Photo – en.wikipedia.org).
If you’ve been watching the weather channel, you may know that we are in the middle of what meteorologists call an “El Niño” event, which is responsible for the winter rain and, yes, even lightning we’ve seen in Pasadena the past weeks and months.
By Zachary K. Erickson
As winter fades into spring and we start leaving the rainy season behind, it’s worth taking a look back. What is an El Niño anyway, and why does it bring rain and snow to southern California? How did the past few months, with a strong El Niño, differ from past winters? How will the precipitation we got affect the current drought, and what can we expect in the future?
Terminology
The El Niño is known as the “positive” phase of a global scale motion known as the El Niño-Southern Oscillation, which is often shortened to ENSO. El Niño means “Little Boy” in Spanish, and is a reference to the Christ Child – so named because it was first associated with warm water off the coast of South America during December and January.
The cousin of the El Niño is the La Niña (meaning “Little Girl”), which is also called the “negative” phase of ENSO. Whether the Earth is in an El Niño, La Niña, or “ENSO-neutral” state is determined mainly by looking at ocean water surface temperatures in the Pacific. Typical El Niño and La Niña years are shown below. During an El Niño, the tropical ocean is much warmer than usual and that warming signal extends up the west coast of the United States, bringing warm waters to California. Temperature changes from normal can be up to 4 °C, or 7 °F. The La Niña effect is almost exactly the opposite, and is associated with cold waters near the equator and cold water off the California coast.
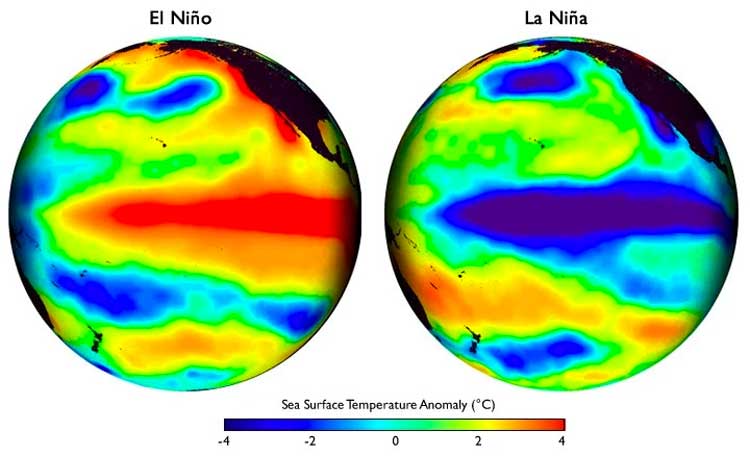
Two views of the Pacific Ocean showing El Niño and La Niña conditions. Red means warmer than average temperatures, and blue is colder. (Photo – iri.columbia.edu).
This ENSO effect is caused by water masses sloshing back and forth across the Pacific Ocean, not altogether unlike water in a bathtub – if, that is, your bathtub were about 5 million times longer and 10,000 times deeper than normal. But unlike your bathtub, the Pacific Ocean has winds above it that, near the equator, run east-to-west. These winds are called the Trade Winds, and have determined the course of sailing ships for centuries. The trade winds act to pile up surface water, which is warmed by the sun, off the Asian and Australian coasts. During an El Niño year, these winds weaken and west-to-east winds called “westerlies” form, allowing this warm water to “slosh” back towards the Americas. These states are shown schematically below. A La Niña year, the opposite of an El Niño, is very similar to a normal year but with more warm water pushed up on the western side of the Pacific.

El Niño and La Niña conditions shown on top, with normal, or ENSO-neutral, conditions on the bottom. Land on the left side represents the east coast of Australia; land on the right side represents the west coast of South America. Normal conditions are similar to a weak La Niña. The thermocline separates warm water at the surface of the ocean with cold water beneath. (Photo – NOAA).
These pictures also show that El Niño conditions tend to bring rain closer to the Americas, including California, whereas normal and La Niña years are wet in Asia and Australia but not here. This is because El Niño conditions bring warm winds to the western coast of the US, full of newly evaporated water vapor waiting to form clouds and storms. But here we have to be careful, since ENSO events refer mainly to the anomalous temperature in the equator, and not the weather patterns that change because of it. The best we can say is that El Niño years tend to bring high precipitation to southern California, through complicated and not well-understood interactions between the tropical ocean surface temperature, the Trade Winds, and the jet stream. This is certainly not always the case; in fact, only 60% of El Niño years since 1950 resulted in above average precipitation in the Los Angeles area.
What about the 2015/16 season?
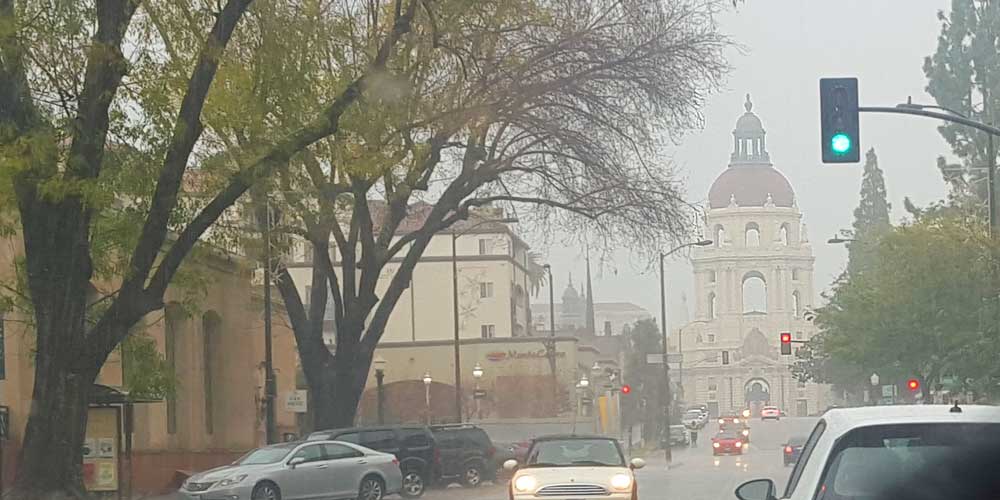
Pasadena Senior Center during a recent storm, with City Hall in the background (Photo – Emmanuel Krauletz ⒸColoradoBlvd.net).
The El Niño of the past few months was incredibly strong; indeed, only two other such events have been recorded since 1950, and both of them – the winters of 1982/83 and 1997/98 – brought more than double the average precipitation to the Los Angeles area. In contrast, this year – according to NOAA data and despite the recent storms – has had below average rainfall for the LA area, and indeed for all of coastal southern California. While there is a chance for more rain this month, it seems likely that precipitation around Pasadena will stubbornly stay below average. That being said, a lot of the rain may have been diverted to the Sierra snowpack, which is currently registering slightly above average for the current time of year. This is good news for us, as the snowpack contains much of our summertime water storage!
What’s next for us?
What goes up must come down, and the past two strong El Nino events were followed by moderate to strong La Niña conditions the following year. As with an El Niño, La Niña conditions tend to bring dry weather to the west coast…but not always. The last moderately strong La Niña, in 2010/11, actually gave downtown LA 33% more rain than usual.
If you get frustrated with all of these “tend to” and “probably” statements, there’s a good reason for them: weather prediction is tricky over small areas (on the global scale, southern California and even the entire west coast is “small”). But if we consider the planet as a whole, accurate predictions can be made. So at the end of this article, I’d like to take a moment and consider how El Niño fits in at the largest of scales.
There’s been considerable attention in recent months and years concerning global warming or climate change, including a major international summit in Paris last December. The planet is warming, and you may sometimes hear statements that such-and-such a year is the “warmest on record’”– 2005, 2013, and 2015 have all been awarded this dubious honor. Now, this human-induced warming signal is covered up by natural variability, of which ENSO is a large part (and, I will hasten to say, is probably not at all affected by humans). While I cannot predict what will happen to California in a El Niño or a La Niña year, I can confidently say that, globally speaking, La Niña years are cooler and El Niño years are warmer. Want to guess the fourth warmest year – and, at the time, the “warmest on record”? 1998, the year of the only El Niño on record stronger than the 2015/16 season. My prediction, then, is that 2016 will be the next “warmest on record.” Come back in January 2017, and we’ll see if I’m right!
Zachary K. Erickson is pursuing a Ph.D. in oceangraphy at Caltech. In addition to research, he is involved in science and environmental policy, and is a member of Citizens Climate Lobby (Pasadena-Foothills Chapter) and president of Science & Engineering Policy At Caltech. In his free time, he is an active musician in the Pasadena area.


Leave a Reply